Milky Way
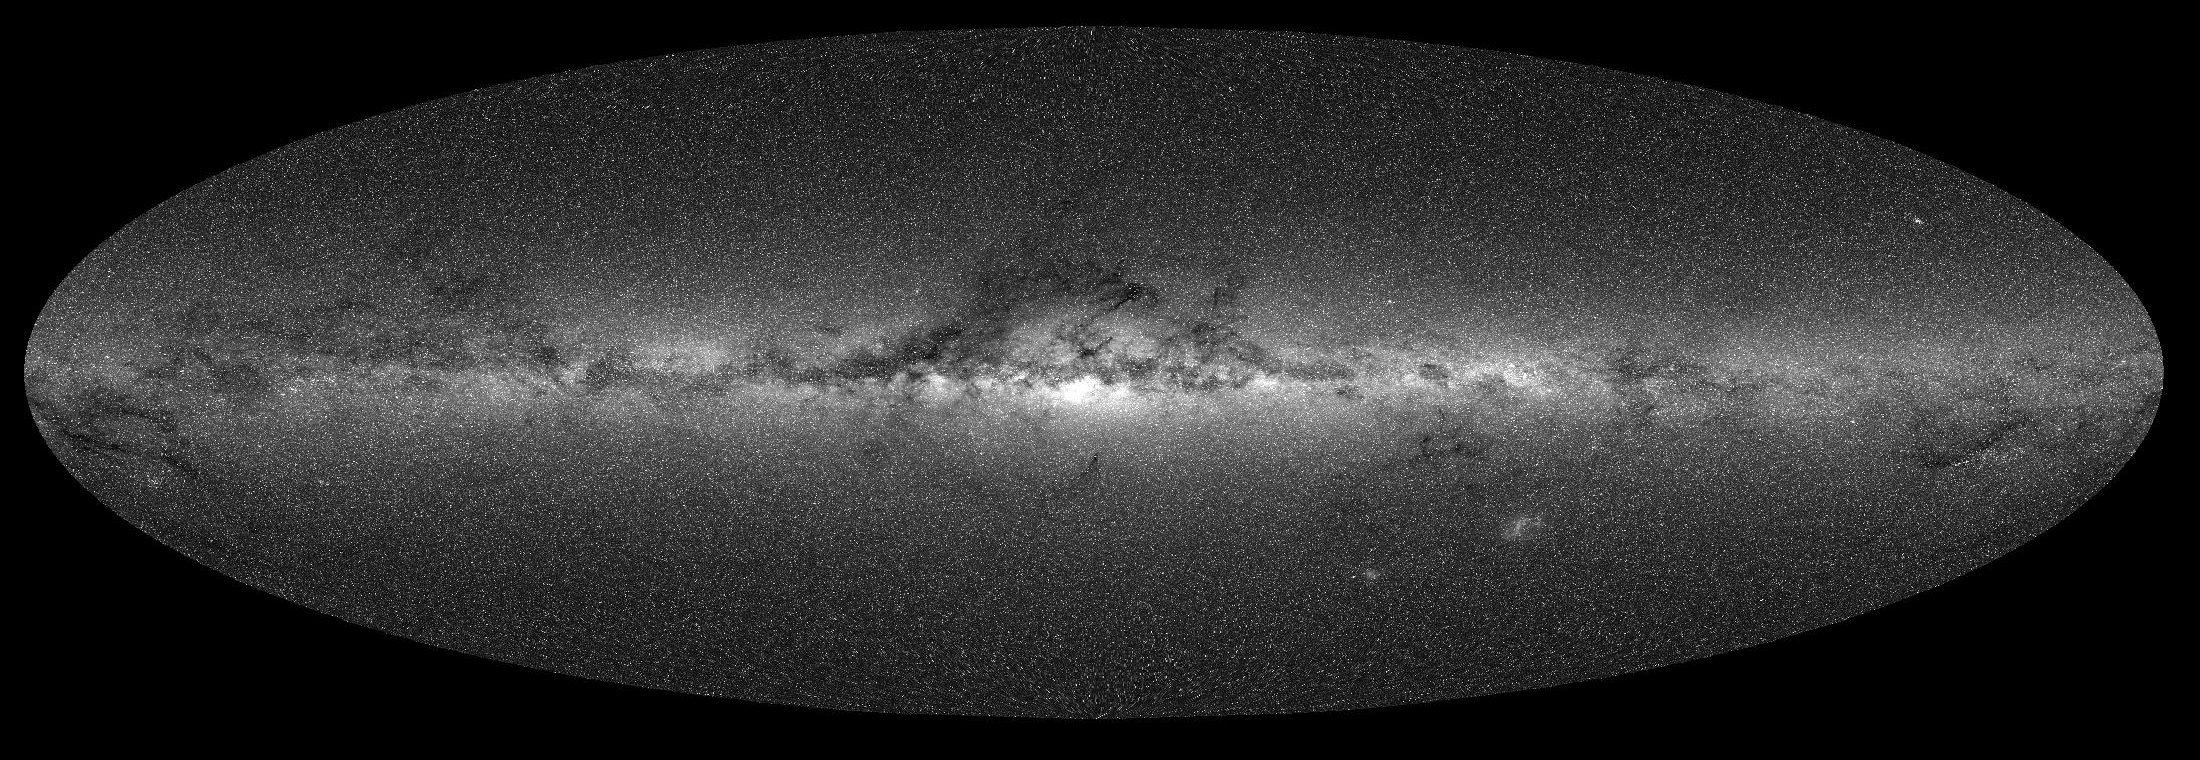
Milky Way is the hazy band of white light across the sky produced by numerous amount of stars each of which is invisible to the eye. Modern astronomical instruments are able to resolve the Milky Way into stars. Thanks to the Gaia mission, we now have accurate positions and photometric data of 1.8 billion stars from the Gaia Early Data Release 3 (EDR3). The above image is created by adding the light of 300 million brightest stars with magnitude larger than 6.5 from EDR3 (see Section 15 of this pdf file for a brief description of the calculation). When the full data are used, the resulting image is even more stunning.
The features shown in Figure 1 match photos of Milky Way. However, some features are clearly beyond naked-eye visibility. So I created a cartoon version of the picture to depict the Milky Way visible by the eye. It's based on the Milky Way boundary data provided by Jarmo Moilanen. The following image plots this boundary (yellow line) on top of the image constructed from the Gaia data.
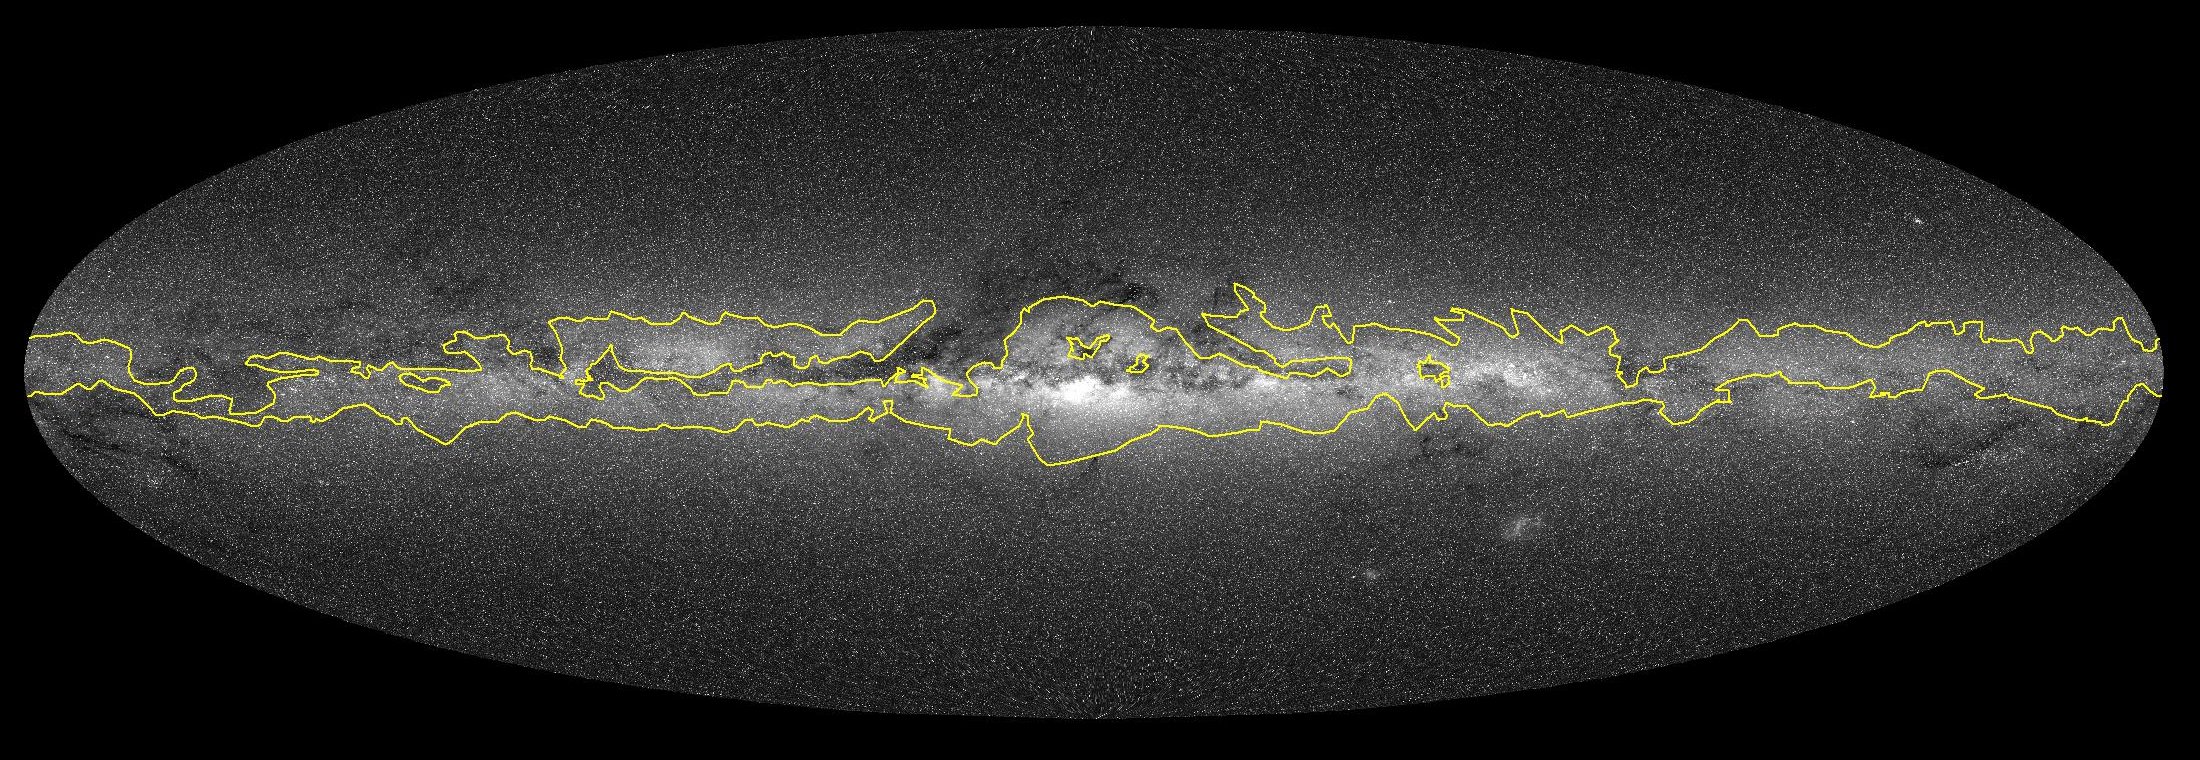
We can see that the approximate boundary data roughly match the simulated image. The surface brightness of the Milky Way is not uniform. The brightest regions are concentrated in galactic longitudes between about -80° and 0°, passing the constellations Carina, Crux, Centaurus, Norma, Ara, Scorpius and Sagittarius. Outside these regions, the surface brightness generally decreases with increasing galactic longitude |l| and reaches minima in 155° ≲ l ≲ 180° (in Perseus and Auriga). The cartoon version ignores the patchy bright spots and models the Milky Way surface brightness as a function of galactic longitude. The following is the cartoon version of the Milky Way used in our star charts. The relatively low contrast between the cartoon Milky Way and background is chosen to reflect the reality that the Milky Way is faint and even invisible in light polluted skies.

This cartoon picture is of course not ideal. The following is another rendition of the Milky Way, which is generated using the Gaia data to capture the variation of surface brightness in various regions of the Milky Way more accurately. Regions with low surface brightness are removed to approximately match the boundary data.
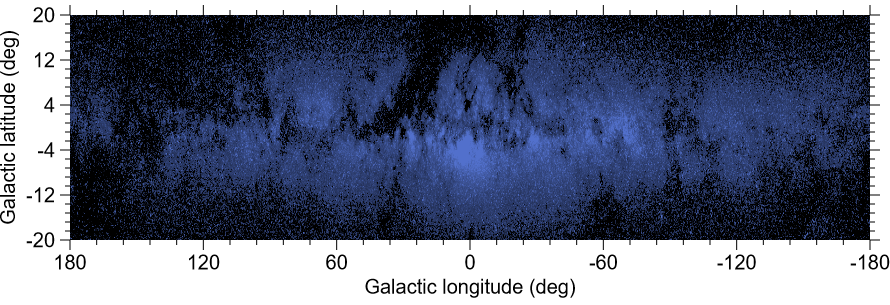
I decide not to use this version for the star chart pages because it requires more computational resource to render. In reality, Milky Way's visual appearance is sensitive to the brightness of the background sky and probably also sensitive to the acurity of one's vision. Given the amorphous appearance of the Mily Way, the cartoon picture is adequate for the relatively low-resolution star charts on our website.